Search for an Obsidian Gantt plugin and you mostly find Mermaid: a diagram you write by hand, in a code block, that knows nothing about your tasks.
That is fine for a diagram inside a document and useless as a working plan, because nothing on it is a task you can open, tick off or reschedule. Obsidian is excellent at notes and poor at schedules.
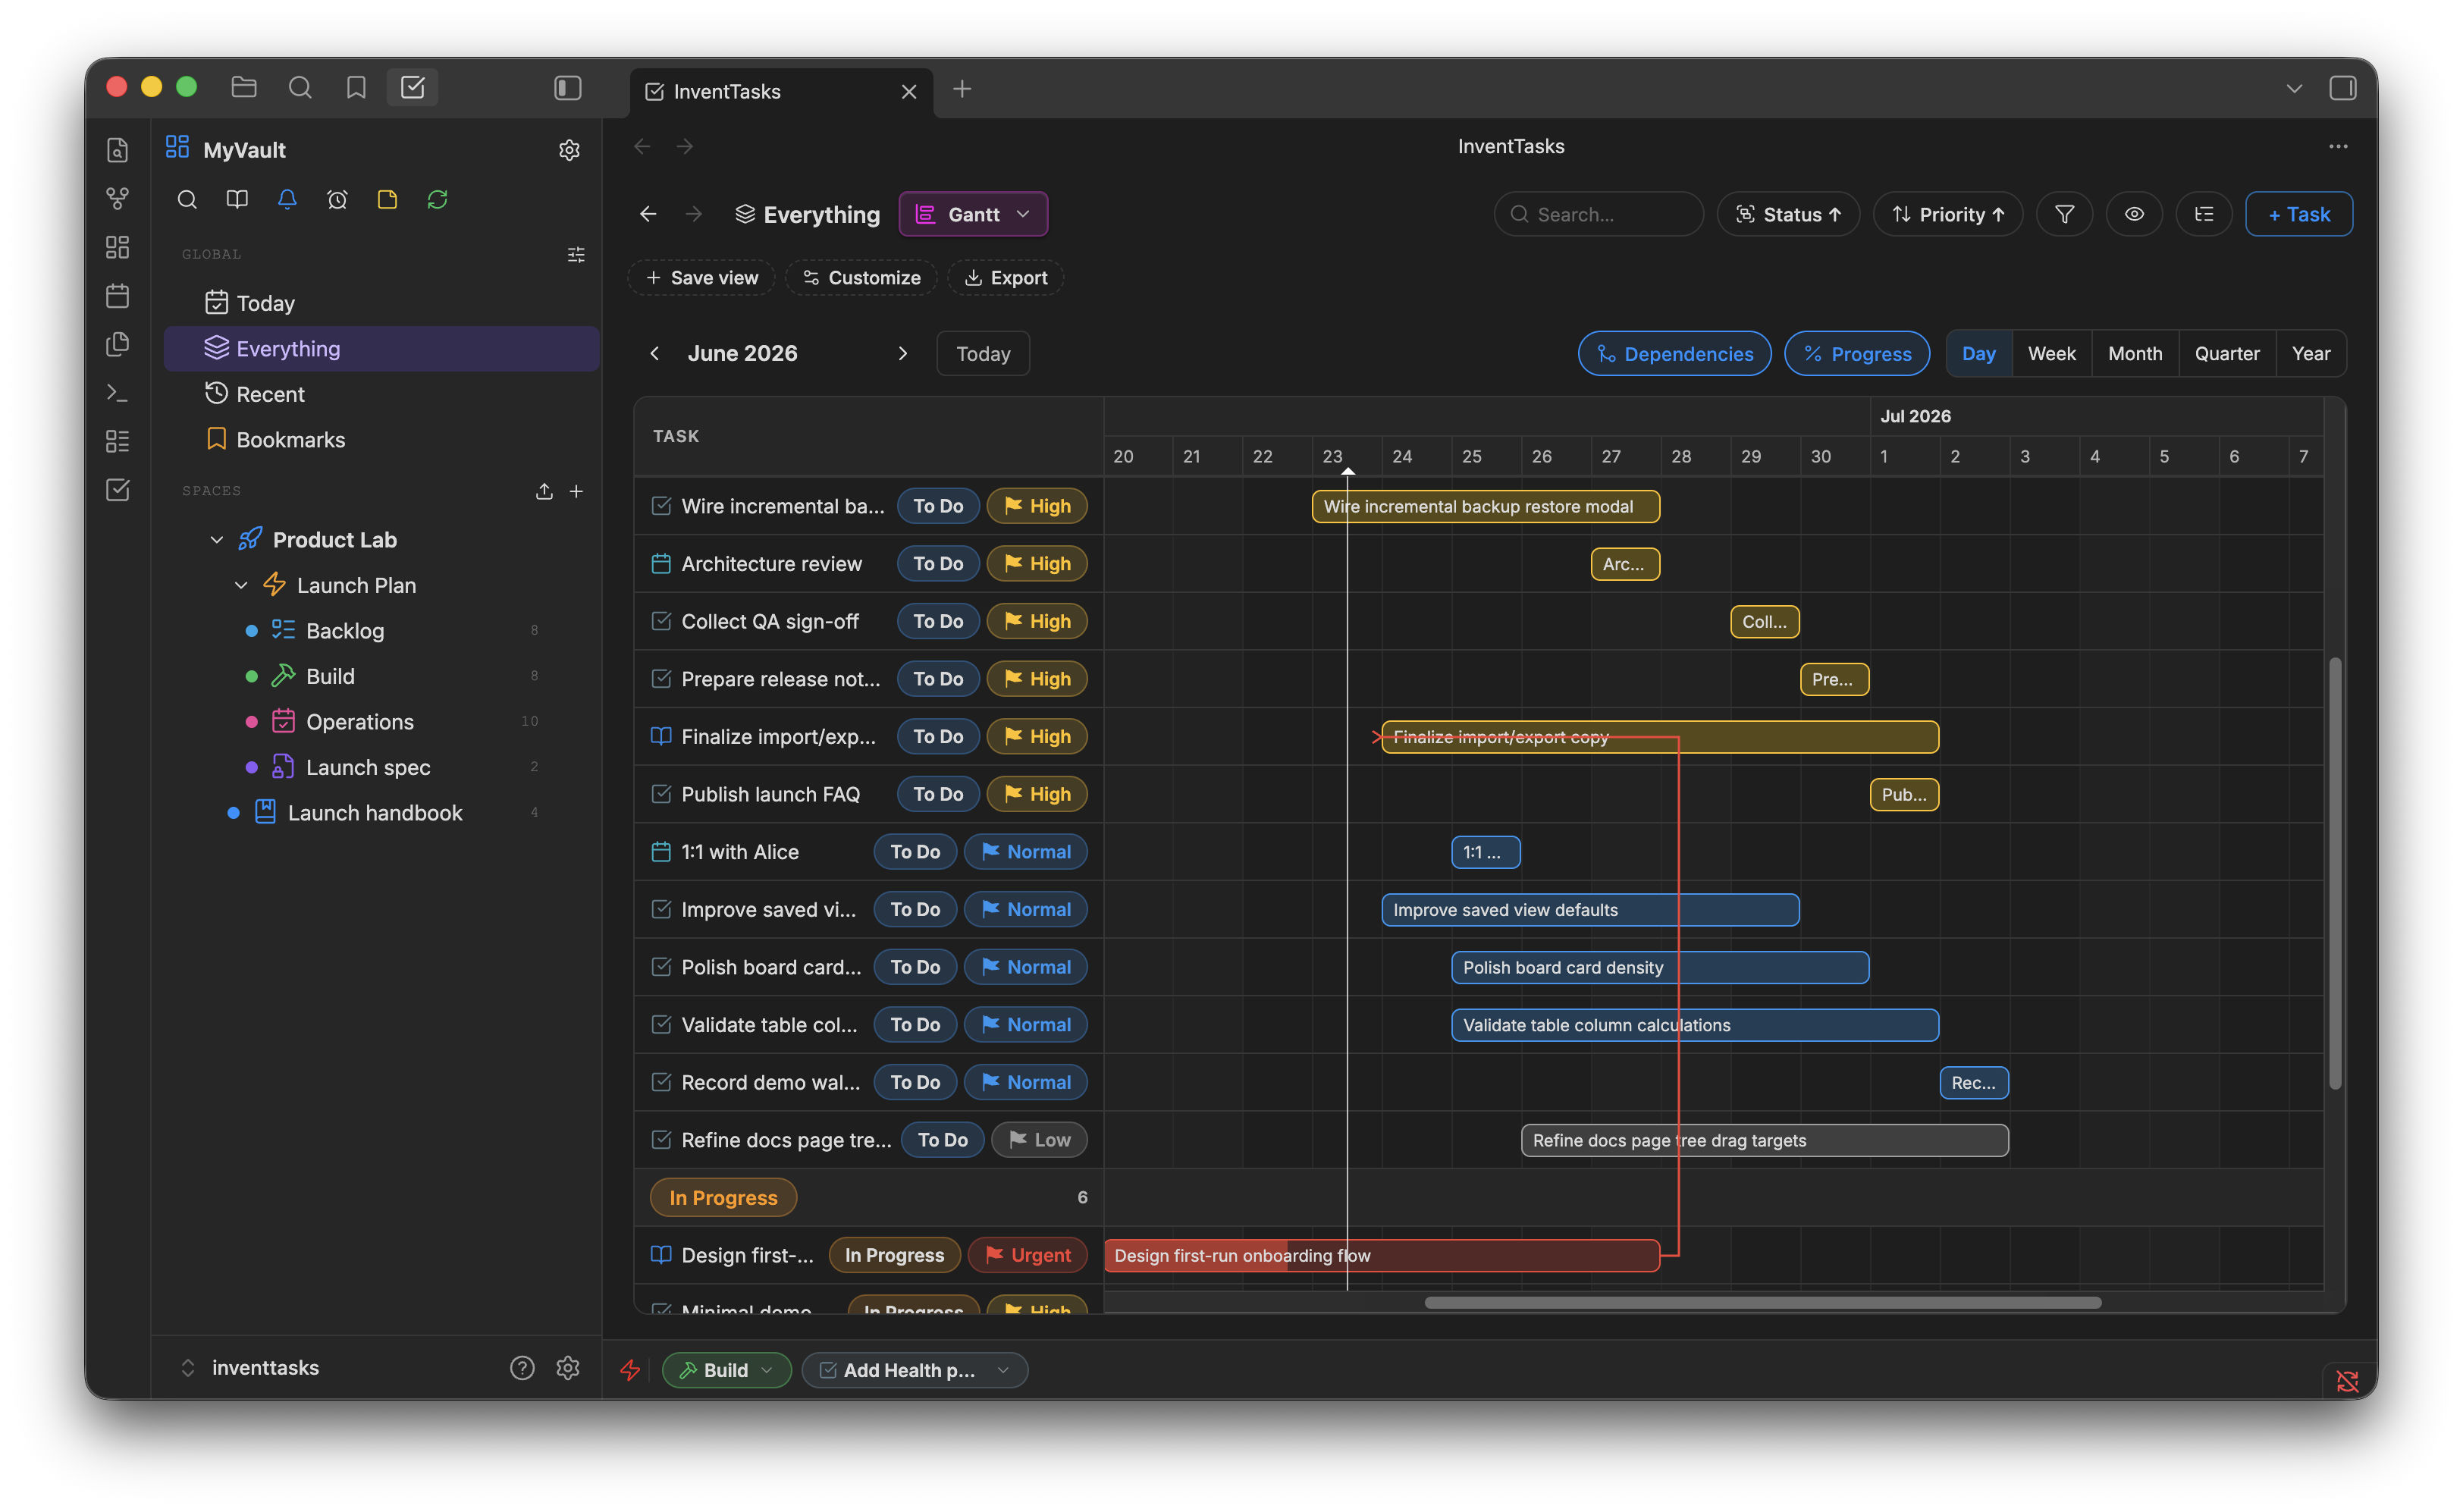
InventTasks draws the chart from real Items. Every bar is a Markdown file with
start_date and due_date in frontmatter. Drag the bar and the file changes.
Close the task and the bar updates. There is no separate project database to
keep in step.
What the chart does#
- Bars from start and due dates, with the task title and configurable colouring by status, priority, type or any custom field
- Dependencies — blocks and waiting on relationships, drawn between bars and kept symmetric on both tasks
- Progress shown on the bar, either entered by hand or derived automatically from subtasks or a checklist
- An unscheduled tray for tasks with no dates yet, so nothing quietly disappears from the plan because someone forgot a date
- Zoom from day to year, so the same project reads as this week's detail or next quarter's shape
- Export to PNG or PDF when someone wants the chart in an email
It is one view of the same tasks#
The Gantt chart is not a separate mode you have to maintain. It is one of six layouts over the same Items — switch to Board to run the week, Calendar to see deadlines, Table to bulk-edit, and back to Gantt to see the shape of the whole thing. Filters, grouping and saved views carry across.
That matters more than it sounds. A plan that lives in its own tool drifts from the work within a fortnight, because updating it is a second job. Here the plan is the work.
Honest limits#
- Gantt and Timeline are read-only on mobile. You can look at the chart on a phone but not drag bars; the screen is too small for it to be anything but frustrating.
- This is not Microsoft Project. There is no resource levelling, no critical path calculation, no baselines, and no multi-user scheduling — InventTasks is single-user by design.
- Dependencies inform, they do not enforce. Marking A as blocking B draws the link and can warn you when closing B, but it will not refuse the change or automatically move dates.
Where the data lives#
---
id: TSK-00042
title: Ship the API
status: in_progress
start_date: 2026-09-01
due_date: 2026-09-14
progress: 60
relationships:
  blocks: [TSK-00043]
---
That is the whole storage format. Open the file in Obsidian's editor, keep it in Git, sync it with your own server, grep it, or read it in ten years with any text editor.
Try it#
The free version includes the Gantt view with every other feature — the free plan limits capacity (1 Space, 5 lists, 50 open tasks), not features. If a project fits in that, you never need to pay.